Fully refreshed review of Ukambani - last version was from 2021. This is now current, with maps, errors fixed and the 2022 election result included
0 Comments
The history of Busia District (and County) as told through its elected representatives since 1957.
Back with Number 16 in the series, one of the tougher ones: South Nyanza (today Homa Bay and Migori). A few learnings for me as I put this together.
The latest instalment - No.15 - in the series covers the political history of Taita-Taveta District and County since 1957.
No.14 in the series; a deep dive into the history of Kakamega and (after 1989) Vihiga districts, from the perspective of their political representation. Including a basic analysis of the 2022 election results in the region.
Back with No.,13 in this series on the political history of the rural Mijikenda of Kilifi and Kwale. Long and complex and still a few loose ends.
A history of Mombasa through the perspective of its political representatives. Part of a series (No.12). Had to do quite a bit of research to sort out the early period 57-62 better in my mind. There may still be errors, so please comment if you see them.
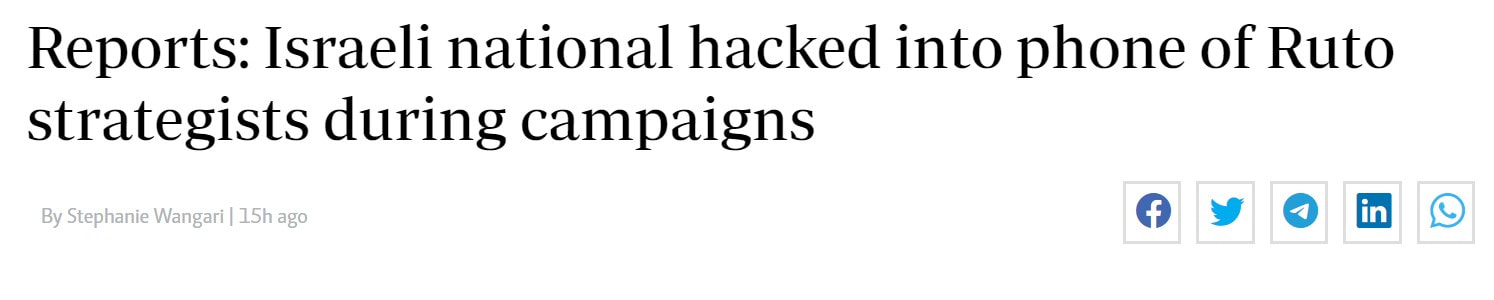
The Ruto campaign hacking allegations, which became public on 15th February, were initially followed up in many media outlets around the world. It also notable that Odinga, the day before, made reference to "hiring ethical hackers" which may have been an attempt to pre-empt the story he knew was about to break: 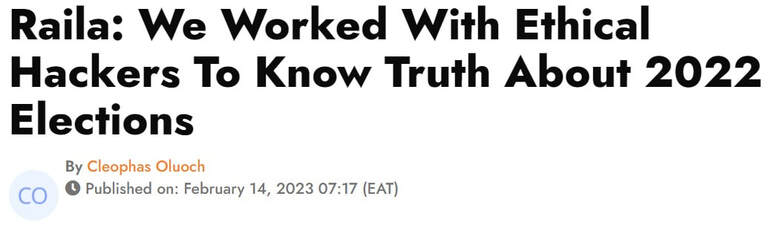 As the original Haaretz site is behind a partial paywall (I could read it initially, but now cannot), other links include: https://www.theguardian.com/world/2023/feb/15/political-aides-hacked-by-team-jorge-in-run-up-to-kenyan-election https://www.occrp.org/en/storykillers/hacks-bots-and-blackmail-how-secret-cyber-mercenaries-disrupt-elections Some feedback from Dennis Itumbi, one of the Ruto campaigners targeted: https://www.the-star.co.ke/news/realtime/2023-02-16-this-is-how-israeli-hackers-accessed-my-account-itumbi/ Kenyan responses: https://www.youtube.com/watch?v=2ODvN60afVU https://ntvkenya.co.ke/news/how-israeli-hacker-accessed-rutos-election-strategists-phone/ https://www.pd.co.ke/news/kenya-kwanza-turns-heat-on-raila-over-hacking-claims-169707/
Lots of sound and fury, not a lot of new substance yet.
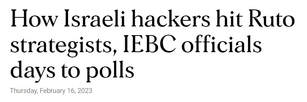
But follow-on reports are missing from the 17 and 18 Feb press, also unexpected and interesting. 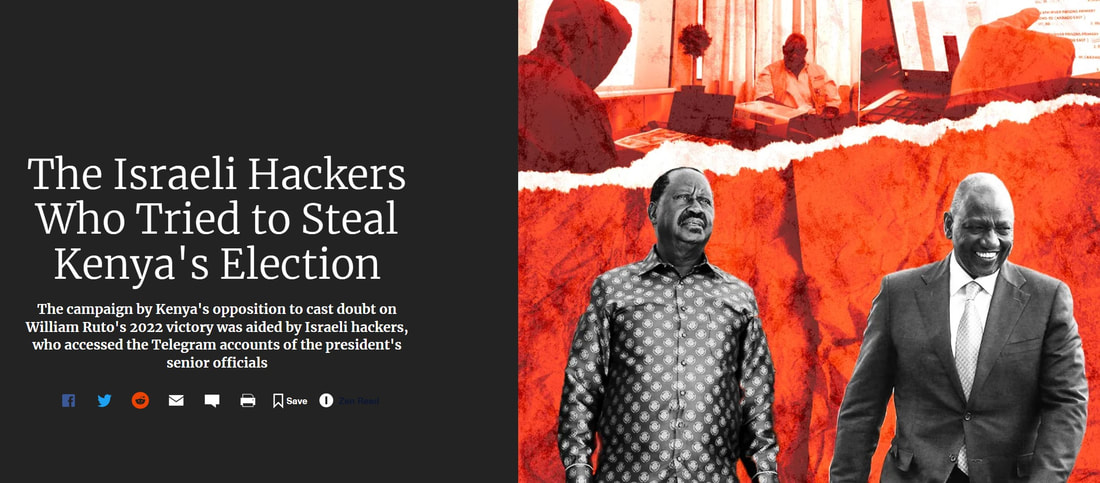 Breaking news: An extremely detailed and specific set of allegations about an Israeli private sector cyber-intelligence team for hire, which appears to have been actively hacking the Ruto campaign during the election for Azimio and - by implication if not exact claim - to have played a part in the recent campaign to manufacture fake results and cast doubt on the presidential election results.
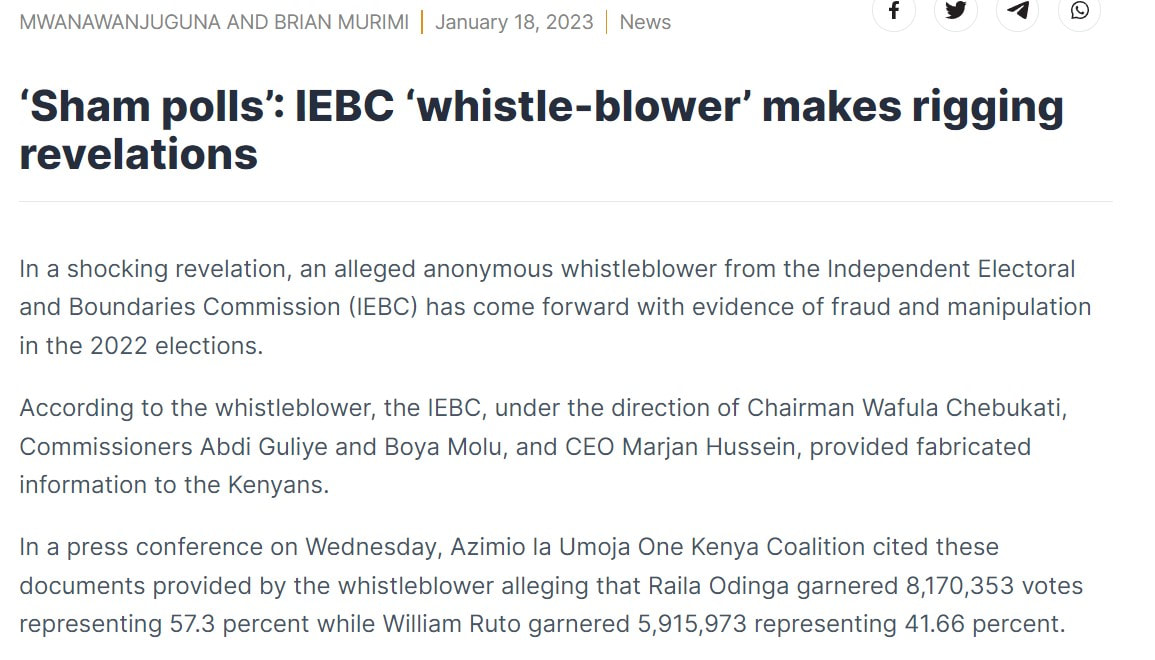
Read and judge for yourselves (with thanks to a friend for passing this on): https://www.haaretz.com/israel-news/security-aviation/2023-02-15/ty-article-magazine/.premium/the-israeli-hackers-who-tried-to-steal-kenyas-election/00000186-4b7f-d5d4-a5e7-ebff5c9c0000 it also names an individual who might have played a role in manufacturing the fake election results. More, I suspect, to follow. Following a well-trodden path, an anonymous source (claiming to be an IEBC whistle-blower) recently published a set of alternative results of the 2022 presidential general election, which was narrowly won by William Ruto (according to IEBC staff and a unanimous Supreme Court verdict). These alleged results conveniently appeared just after IEBC Chairman Wafula Chebukati has retired, so could no longer properly defend himself. They were then picked up by the opposition and trumpeted as evidence of fraud:
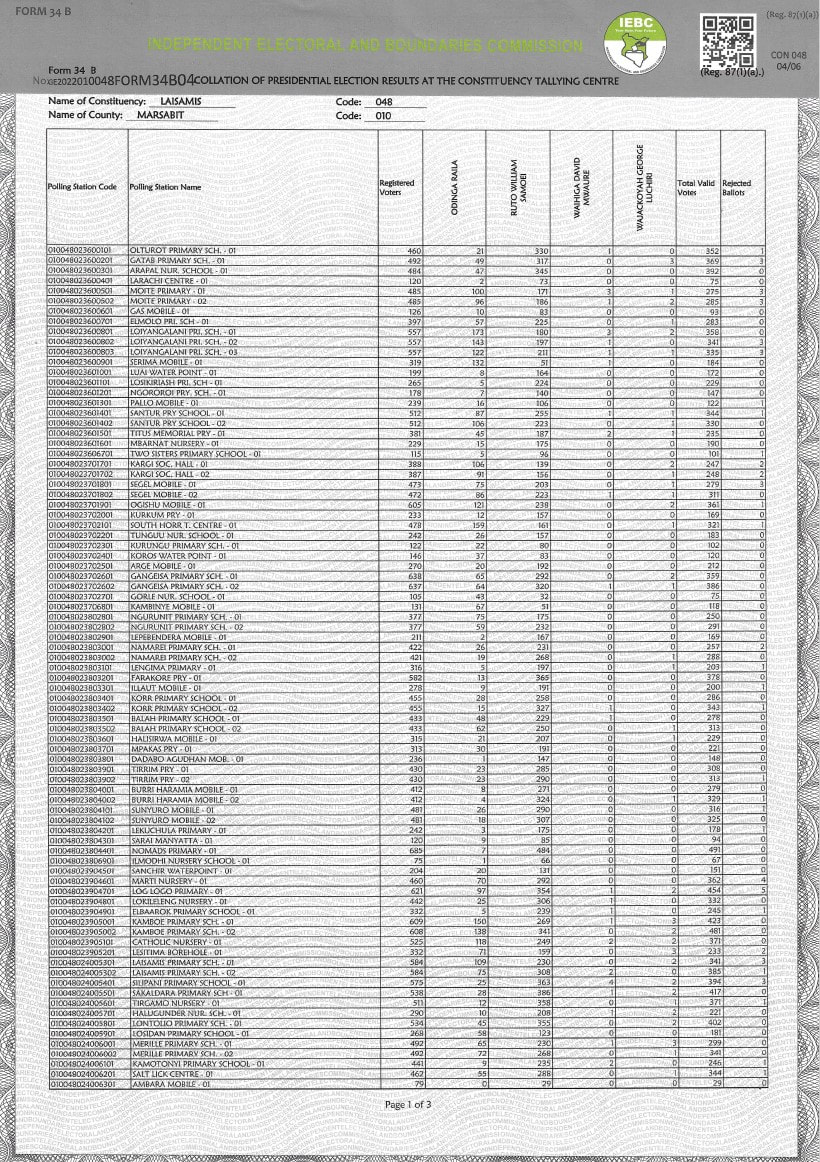
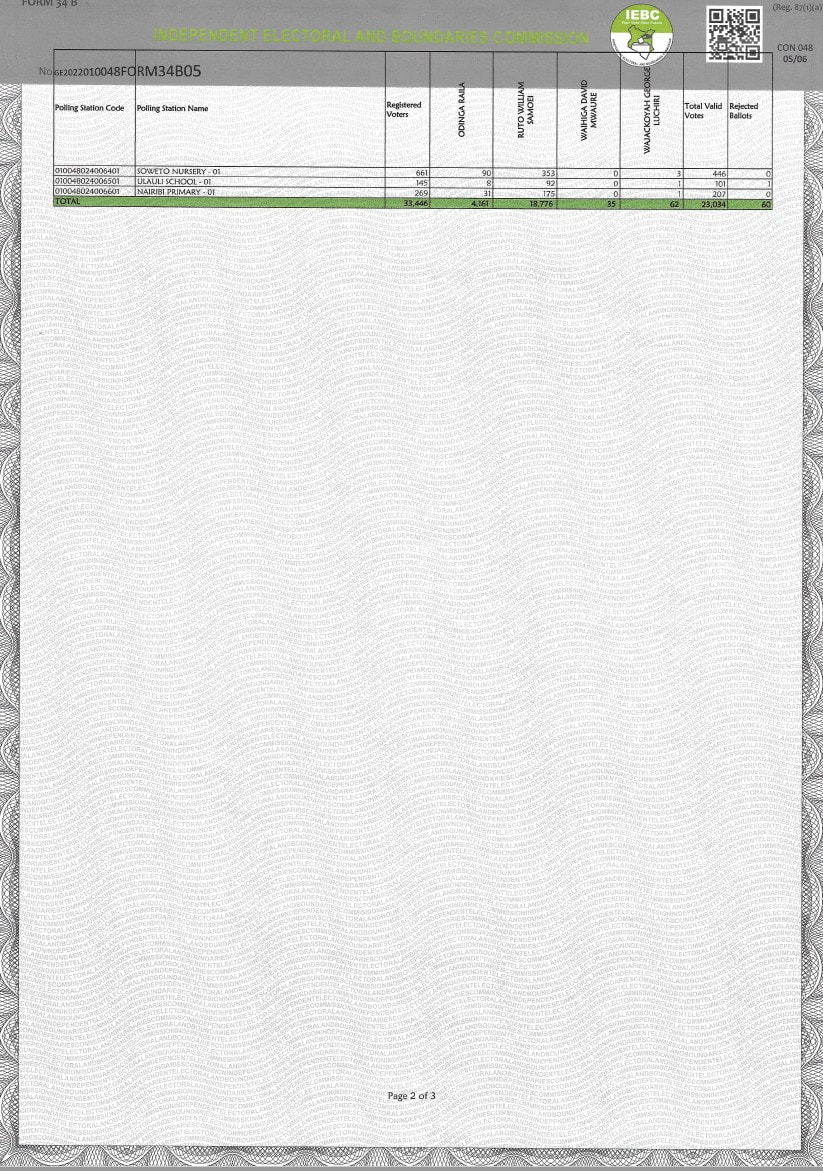
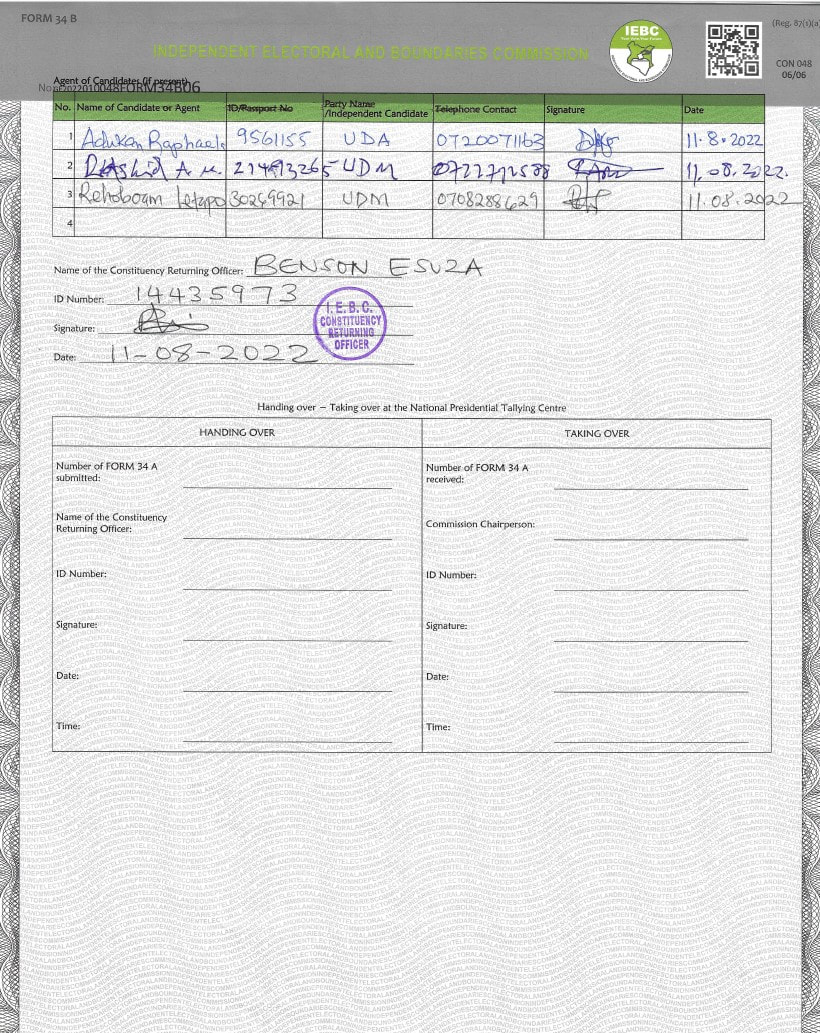
After 2017, I looked at the alleged real polling station-by-polling station results produced by NASA after the polls and concluded (after several weeks of work) that they were a clumsy fake. So having been asked to look at these, I was not feeling particularly optimistic, but decided to give it a try. The main differences between these alleged whistle-blower results ("AWBRs" henceforth) and the 2017 fakes are 1. They come from an anonymous source, not the Odinga camp (though they may of course be the same thing) 2. They are only at the constituency level (no polling station results, so nothing can be verified or disproved explicitly by reference to posted 34A polling station forms). 3. More than 70% of them (209 seats) match well with the official results, including virtually every seat which Azimio won. The overall result claimed by the ABWRs is a 58% to 42% victory for Raila over Ruto, in contrast to the 49%-50% official result. So the difference is huge. Both sets of results report around 14 million votes cast, so the AWBRs have 1.2 million votes moved from Ruto to Raila. And since the results agree (to within 1000 votes) in the majority of constituencies, the difference are glaring. Which means they should be relatively easy to isolate and assess for plausibility. The version I reviewed came from here: https://newsblaze.co.ke/iebc-whistle-blower-2022-presidential-election-results-tally. This was the original posting : https://theiebcwhistleblower.s3.us-west-2.amazonaws.com/True-Results.pdf, but they are identical. Approach: Compare the result constituency-by-constituency between the two sets of results, looking for differences. When found, determine what changed and how, then compare with other elections for the same constituency on the same day (particularly the MP results as they are a direct comparator) and also compare for plausibility with other results from the same county. Check the two form 34Bs on a sample basis for plausibility of each. Analysis: The results are a mix of: 1. Real and agreed results (almost all the results in Mombasa, Kilifi, Lamu, Garissa, Wajir, Mandera, Embu, Kitui, Machakos, Makueni, Samburu, Turkana, Pokot, Baringo, Vihiga, Busia, Siaya, Kisumu and Homa Bay agree, for example). 2. Transpositions and movements of votes between candidates which could be real. Examples would include Kitui South (5000 more votes for Raila than the IEBC reported, which better matches the MP results) or Matuga (6000 votes moved from Ruto to Raila here). This includes three seats in the north - Laisamis, Isiolo North and Isiolo South - where the reversed results (all votes for Raila are assigned to Ruto and vice versa in the AWBRs) could potentially be true. I haven't checked the 34As but it should be verifiable quickly in a small seat like Laisamis. Either Ruto got 14,000 and Raila 4000 (as IEBC calculated) or the other way round. The IEBC 34B for Laisamis is pretty clearly 14000 for Ruto and appears signed by party agents:
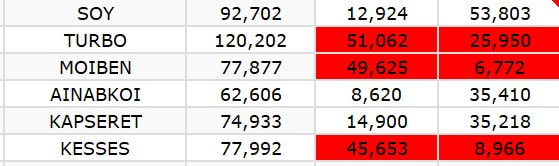
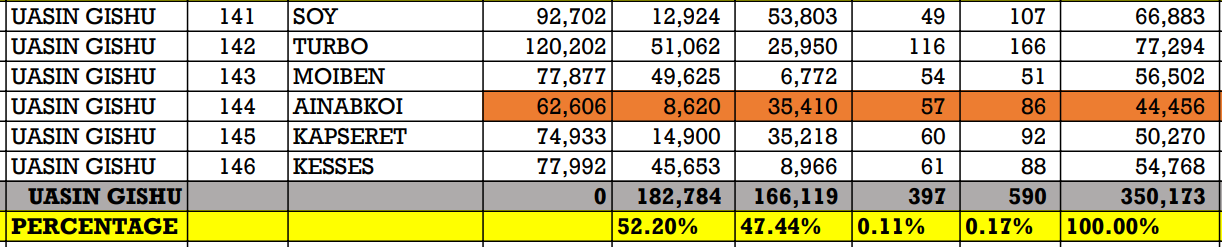
3. Clumsy transpositions which are so obviously false that they lead me to conclude that again we have a fake on our hands. In 43 constituencies (including the three above) the AWBRs reverse the votes for Ruto and Raila in a way which in most cases simply makes no sense. Its been done carelessly and without consideration for logic or consistency. From a sample, the 34B pdf format forms claimed as "proof" have also been cut and pasted childishly to swap the results over. Some Examples Buuri and Maara in the Meru counties. UDA won both seats in the MP contests, and Ruto won by huge margins in all the other Meru seats, but in these two the results have been switched, rather obviously (red indicates that the results reported by the AWBR have swapped the IEBC reported results for the two candidates round). 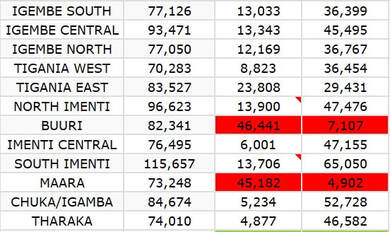 In Nyeri, the home of Deputy President Rigathi Gachagua, where UDA won every seat in Parliament by 4-1 margins, we again see three seats (Tetu, Kieni, Mukurweini) with the Raila-Ruto results switched, plus Mathira and Othaya where 7000-10,000 votes have been moved (leaving the results in Ruto's favour but by smaller margins). Nyeri Town was left as the IEBC reported, leaving a bizarre patchwork which makes little sense: 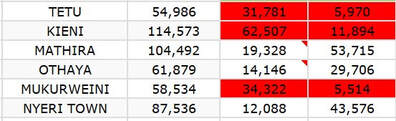 Similarly in Kirinyaga, Martha Karua's home, three of the four results have been reversed, but strangely the 'faker' again left one of the four as it was, producing a bizarre result whereby a 5-1 victory one way switches 5-1 the other way. By comparison, UDA won all four seats in parliament roughly 2-1, they won the Governor and Senator seat 5 and 10-1 versus Jubilee candidates, and the Women Rep seat 4-1: 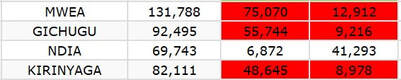 One more example I think clinches that these results are a simple fake: the results in Uasin Gishu, Ruto's home. Few would argue that Raila would stand much chance here. In the Women Representative seat UDA won 6-1 versus ODM, for Governor and for Senator, Azimio didn't even have a candidate and UDA won every parliamentary seat between 3-2 and 5-1. There is simply no possibility that Odinga beat Ruto in Uasin Gishu and won Kesses, Turbo and Moiben by huge margins. Yet that is what the AWBR claims: three of the six seats have had their Ruto votes counted for Raila again and vice versa, leaving the other three results unchanged. And just to be sure I didn't make a mistake in the export, here's the original image from the original whistle-blower site:
Laisamis (a constituency in Marsabit District), mentioned above, can be used an an example of the cut and paste done on the alleged "true" accompanying Form 34Bs to support the faked summary. IEBC Forms contain watermarks to prevent exactly such a thing happening. The left side shows the original (Ruto wins), the right side the AWBR fake (Raila wins).
Zooming in a bit on the 21 and 330 on the first polling station, the watermark on the original in the 330 box reads: "...NDARIES COMMISSIO..." [curling down]. In the Raila fake on the line below, the 21 box reads [curling down] "..DARIESCOM [curling up] "..DBOUN...". You can see someone just cut and pasted the number from left to right side and vice versa. 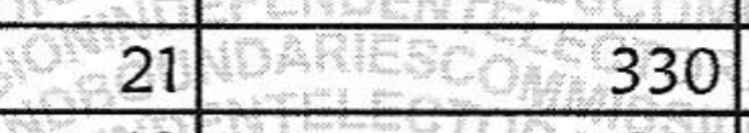 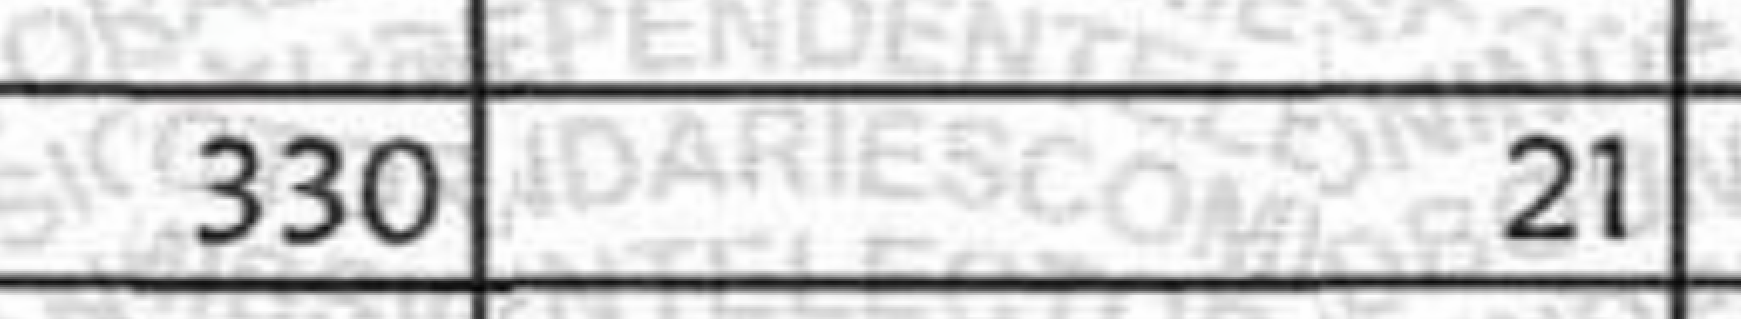 Conclusion: Just as in 2017, this data set is at least partially a gross fake and no credence should be given to its reported results. No politician should use this fake to justify or rationalise any action.
|
|||||||||||||||||||||||||||||||||||||||||||||||||||||||